The 2013 Healy Cup was played at the South Pine Complex from 7th January to 11th January.
The winners this year were Ipswich!

| Riley Bichel | Mitchell Neuendorf |
| Ryan Lukritz | Thomas Cupit |
| Harry Berlin | Nicholas Moyer |
| Bradley Zampech | William Kraschnefski |
| Angus Moody-Stone | Harry Blunn |
| Todd Anderson | Quinn Truloff |
| Zeb Townsley | Jacob Anderson |
Best Individual Performances for the Carnival
| Best Batting Average | Joshua Wright – 128.00 (Eastern Districts Black) |
| Most Runs Scored | Liam Brady – 163 Runs (Metropolitan South West 2) |
| Best Bowling Average | Joel Kerr – 3.10 (Sunshine Coast) |
| Most Wickets Taken | Joel Kerr – 10 Wickets (Sunshine Coast) |
| Most Catches Taken | Samuel Winchester – 8 Catches (Eastern Districts Gold) |
Individual Performance Certificates
Day 1
| Scoring a Half-Century | Liam Brady – 66 n.o. (Metropolitan South West 2) |
Day 2
| Scoring a Half-Century | Dylan McDonald – 53 n.o. (Brisbane North Gold) |
| Four Wicket Innings | Lachlan Maher – 4/21 (Brisbane North Maroon) |
| Oscar Horton – 4/24 (Eastern Districts Gold) |
Day 3
| Scoring a Half-Century | Tom Olsen – 59 n.o. (Sunshine Coast) |
| Thomas Cupit – 50 n.o. (Ipswich) |
|
| Four Wicket Innings | Will Morris – 4/15 (Redlands) |
Day 4
| Scoring a Half-Century | Nicholas Scott – 61 n.o. (Brisbane North Maroon) |
| Tim Proberts – 60 (Metropolitan South West 1) |
|
| Samuel Deacon – 50 (Brisbane North Gold) |
|
| Four Wicket Innings | Eli Daunt – 4/18 (Eastern Districts Gold) |
Day 5
| Scoring a Half-Century | Rhys Jones – 75 (Brisbane North Blue) |
| Five Wicket Innings | Bailey Coleman – 5/26 (Metropolitan South West 2) |
Points table
| TEAM | ROUND 1 | ROUND 2 | ROUND 3 | ROUND 4 | ROUND 5 | TOTAL | |||||||||||||||
| Runs | Wkts taken | Win Pts | Round Pts | Runs | Wkts | Win Pts | Round Pts | Runs | Wkts | Win Pts | Round Pts | Runs | Wkts | Win Pts | Round Pts | Runs | Wkts | Win Pts | Round Pts | POINTS | |
| Ipswich | 198 | 10 | 6 | 9.98 | 194 | 10 | 6 | 9.94 | 332 | 11 | 6 | 11.52 | 120 | 11 | 6 | 9.4 | 169 | 9 | 3.49 | 44.33 | |
| Gold Coast | 217 | 10 | 6 | 10.17 | 237 | 11 | 6 | 10.57 | 180 | 11 | 6 | 10 | 124 | 6 | 2.44 | 168 | 11 | 6 | 9.88 | 43.06 | |
| Brisbane North Gold | 224 | 9 | 6 | 10.04 | 163 | 11 | 6 | 9.83 | 187 | 9 | 6 | 9.67 | 215 | 11 | 6 | 10.35 | 122 | 9 | 3.02 | 42.91 | |
| Cricket Far North | 179 | 9 | 6 | 9.59 | 207 | 11 | 6 | 10.27 | 130 | 10 | 3.3 | 211 | 11 | 4.31 | 217 | 6 | 6 | 9.37 | 36.84 | ||
| Sunshine Coast | 160 | 9 | 3.4 | 154 | 8 | 3.14 | 187 | 11 | 6 | 10.07 | 213 | 11 | 6 | 10.33 | 140 | 11 | 6 | 9.6 | 36.54 | ||
| Brisbane North Maroon | 158 | 10 | 3.58 | 209 | 9 | 6 | 9.89 | 178 | 10 | 6 | 9.78 | 183 | 10 | 6 | 9.83 | 102 | 8 | 2.62 | 35.70 | ||
| Met South West 1 | 221 | 11 | 6 | 10.41 | 120 | 7 | 2.6 | 150 | 9 | 3.3 | 215 | 7 | 6 | 9.55 | 188 | 10 | 6 | 9.88 | 35.74 | ||
| Brisbane North Blue | 133 | 10 | 3.33 | 125 | 9 | 3.05 | 120 | 11 | 3.4 | 188 | 11 | 6 | 10.08 | 218 | 11 | 6 | 10.38 | 30.24 | |||
| Met South West 2 | 183 | 9 | 3.63 | 182 | 7 | 6 | 9.22 | 129 | 10 | 3.29 | 130 | 8 | 2.9 | 157 | 11 | 6 | 9.77 | 28.81 | |||
| Eastern Districts Black | 244 | 11 | 6 | 10.64 | 181 | 8 | 3.41 | 158 | 7 | 2.98 | 189 | 11 | 4.09 | 176 | 7 | 3.16 | 24.28 | ||||
| Eastern Districts Gold | 157 | 5 | 2.57 | 126 | 9 | 3.06 | 168 | 7 | 6 | 9.08 | 92 | 11 | 3.12 | 124 | 11 | 3.44 | 21.27 | ||||
| Redlands | 89 | 9 | 2.69 | 192 | 6 | 3.12 | 116 | 10 | 3.16 | 106 | 7 | 2.46 | 63 | 10 | 2.63 | 14.06 | |||||
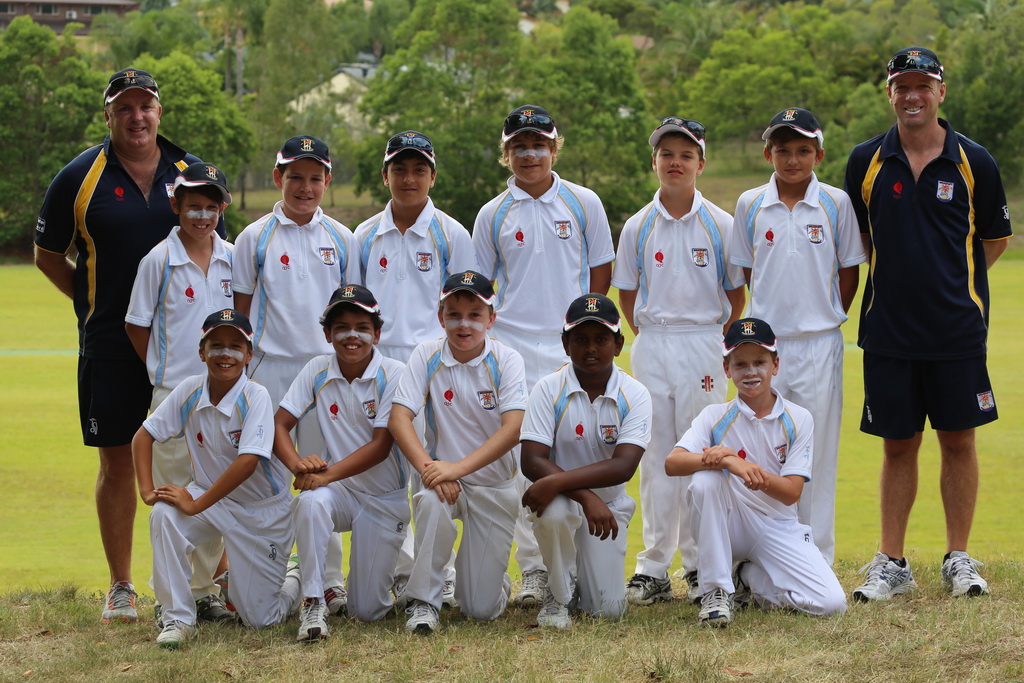
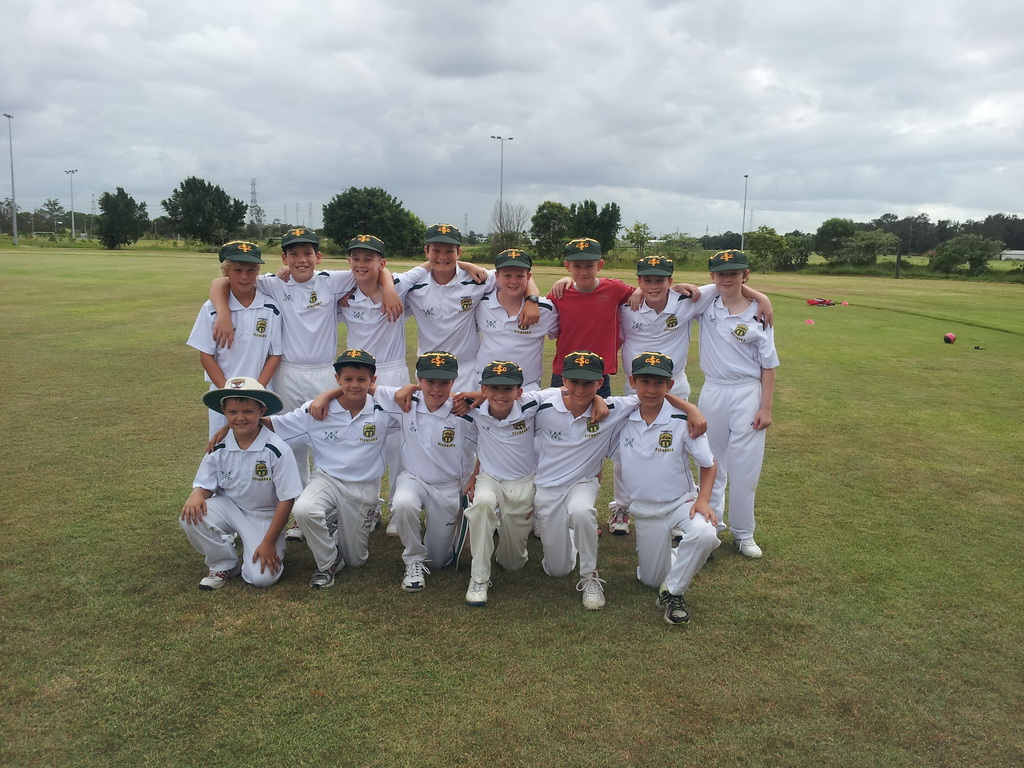
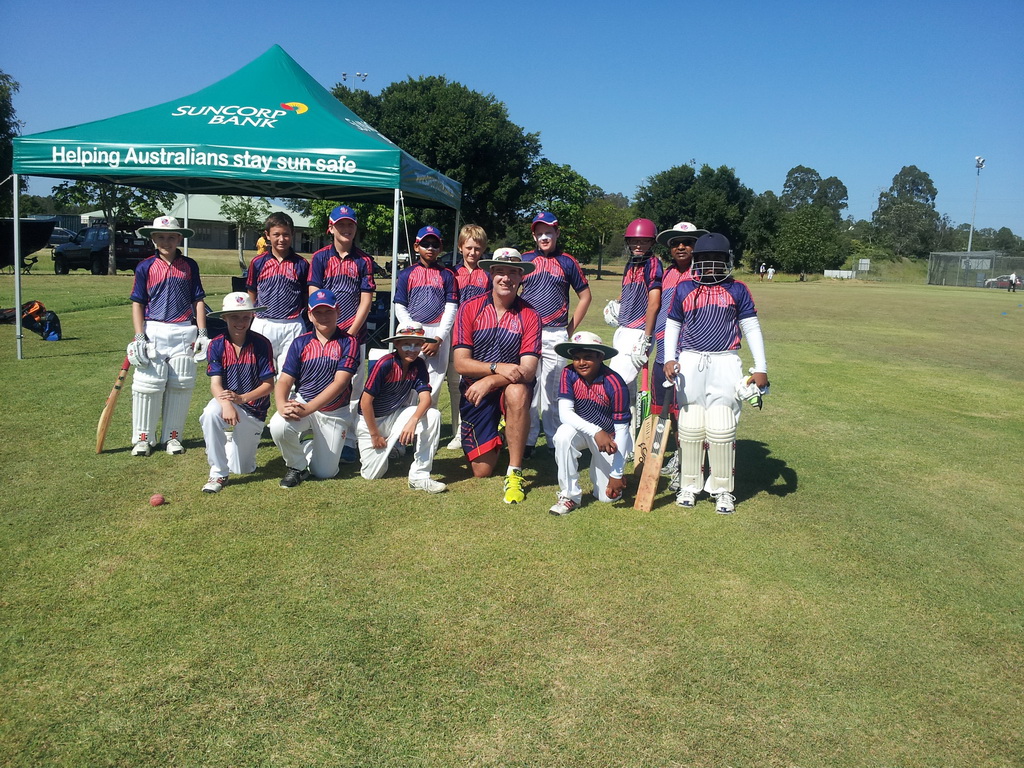
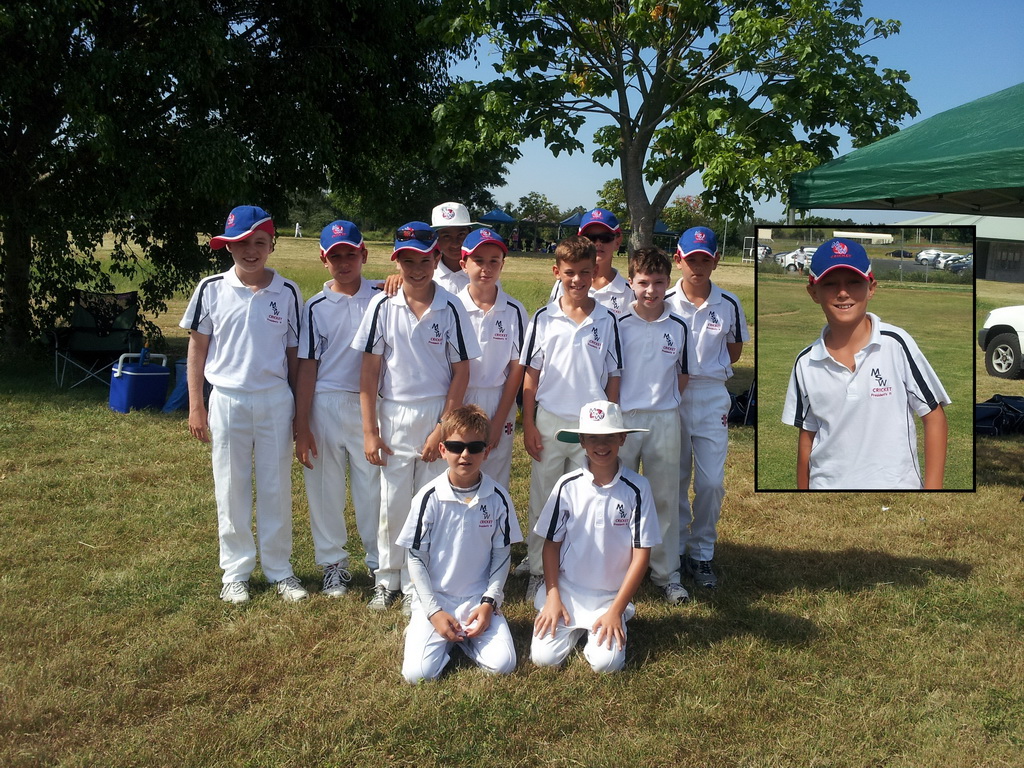
Teams Competing
(Click on the photo for a larger view of the pic – press your browser’s back button to return to this page)
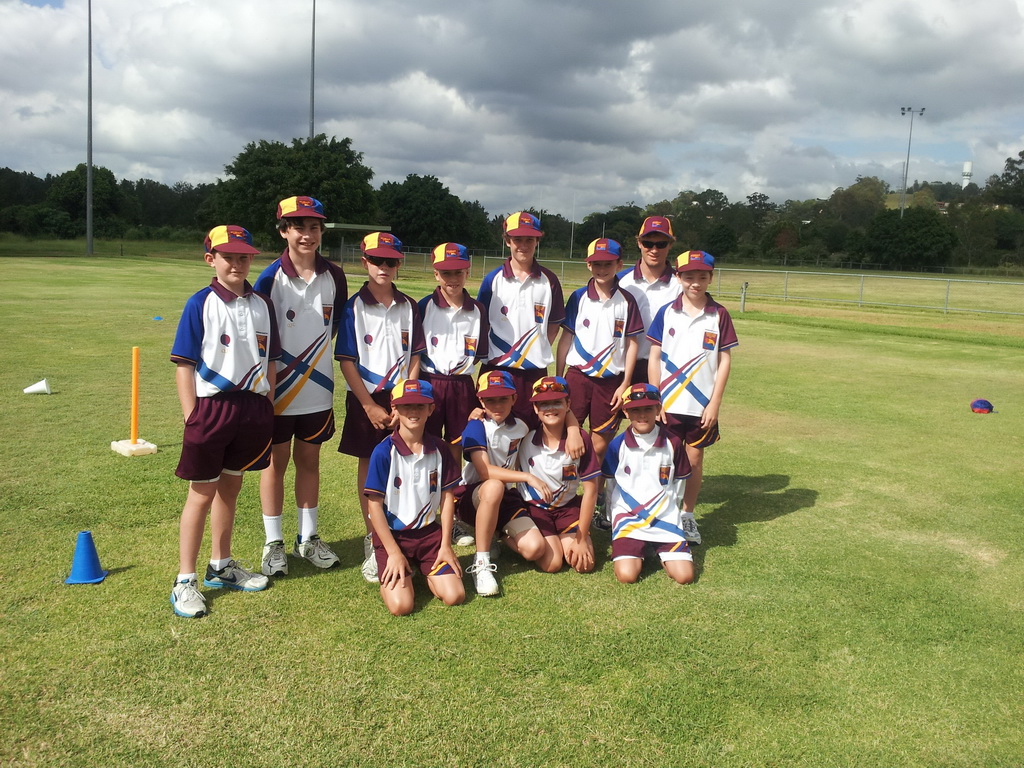 Brisbane North Blue Brisbane North Blue |
 Brisbane North Gold Brisbane North Gold |
 Brisbane North Maroon Brisbane North Maroon |
 Cricket Far North Cricket Far North |
 Eastern Districts Black Eastern Districts Black |
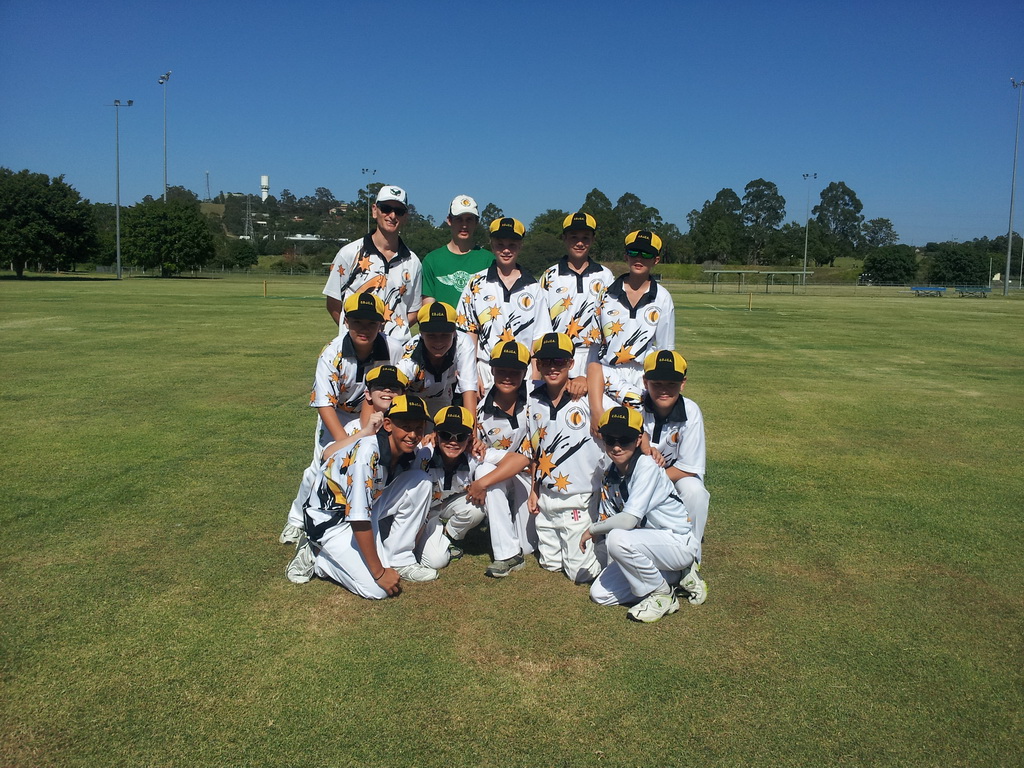 Eastern Districts Gold Eastern Districts Gold |
 Gold Coast Gold Coast |
 Ipswich Ipswich |
 Metropolitan South West 1 Metropolitan South West 1 |
 Metropolitan South West 2 Metropolitan South West 2 |
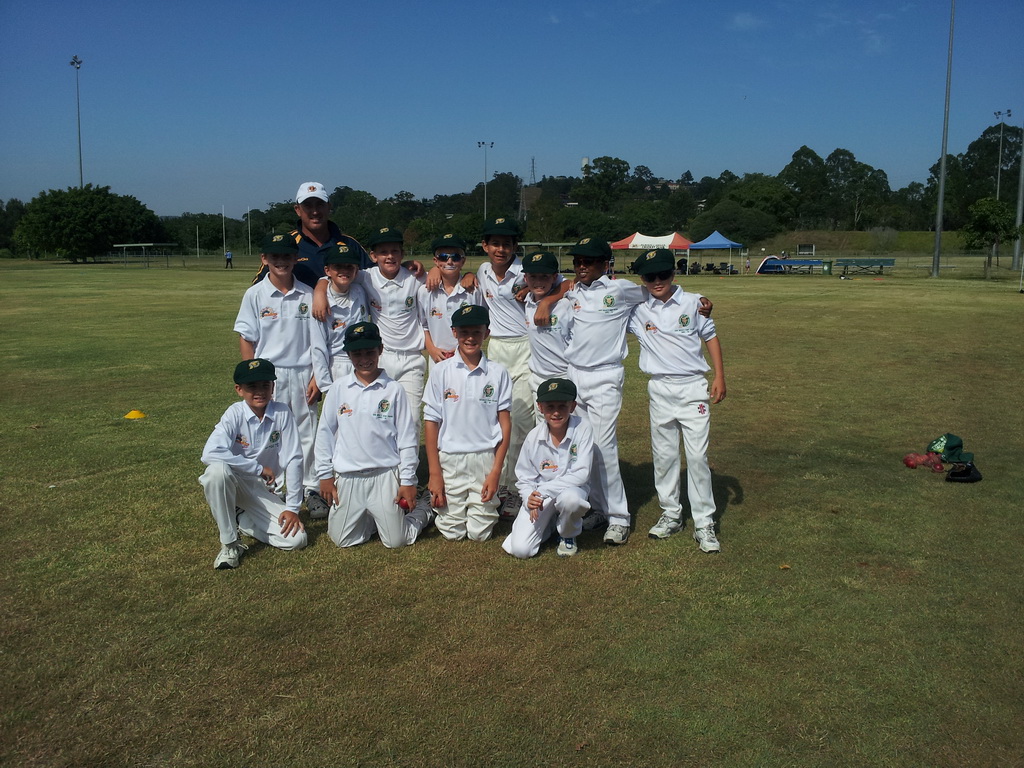 Redlands Redlands |
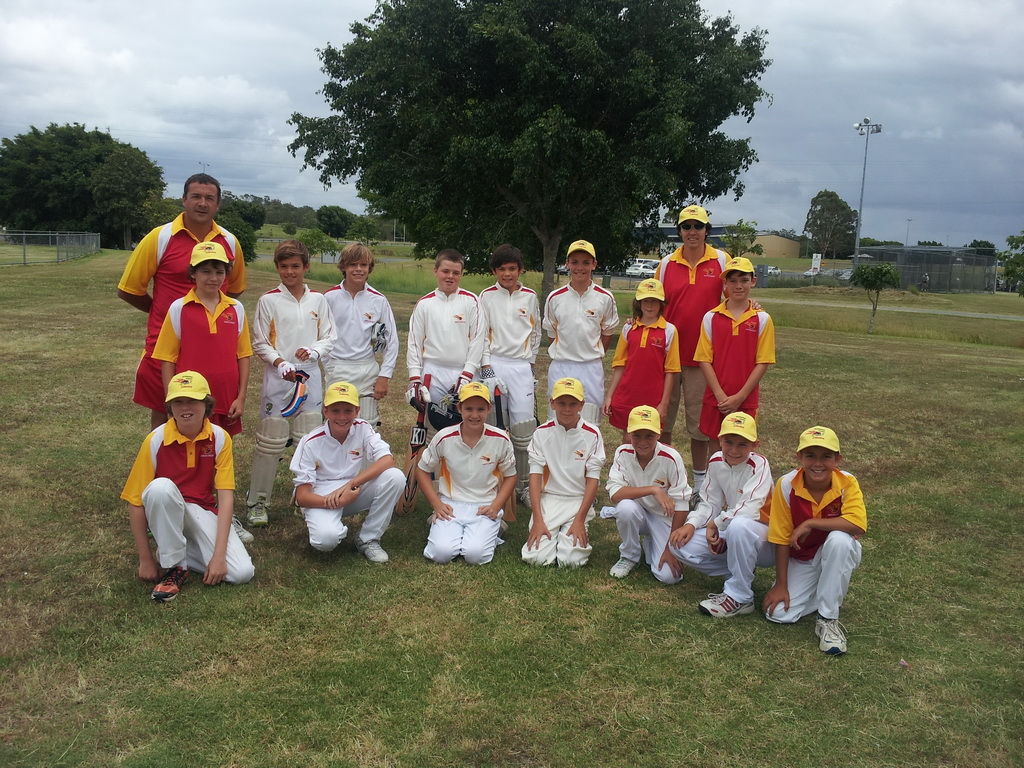 Sunshine Coast Sunshine Coast |